BASED ON TECHNICAL ANALYSIS ONLY YOU HAVE YOUR OWN RISK (Close your ears close your mouth, open your eyes open your imagination. TA is an art)
Wednesday, March 14, 2012
This is Great Try It Now

Monday, February 27, 2012
Technical Analysis: Five Chart Patterns You Need to Know
A guide for the practical investor
So you’re a believer.
So you’re a believer.
You believe there are profits to be made in stocks. You believe you don’t have to pay a high-profile Wall Street banker to make money. You believe the average Joe can earn a healthy fortune using the right system. And you are dead-set on figuring that system out.We agree with you. We believe that with theright tools, anyone can make consistent money in stocks.
And we are going to give you those tools.
A Simple Toolkit for Reliable Returns
In this simple-to-follow, eight-page guide, ChartAdvisor introduces you to five of the most powerful, profitable patterns in stocks.
These stock patterns pave the way 10%, 15%, even 20% gains for each winning trade. True, not the 2000% some people are touting. But it’s darn good money, made using an established strategy, and attainable at relatively low risk. It’s realistic money. And you don’t have to trust your hard-earned cash to some broker’s favorite fad.
In the next few pages, you’ll learn all the skills you need to recognize proven money-making stock patterns, and you’ll get to see these patterns in action.
“I’ve used a variety of … systems, and lost 25% of my portfolio over a 2-3 year period crazily trading hundreds of stocks. When I began using ChartAdvisor and sticking to the rules it made all the difference. The stress of watching stocks is gone, I can do my job without constantly worrying, and I’ve made a 26% return on my portfolio just in the last three months on just a few trades!”~ B. Hiebert, Canada
We’ll also introduce you to our ChartAdvisor system – Three Simple Steps to Stock Profits. Whether you decide to continue with ChartAdvisor or not, after reading this guide, you’ll …
Discover How To:
1. Identify profitable stock patterns
2. Minimize your risk
3. Maximize your return in up and down markets
Make money on the stock market
You’ll learn how to make big money on stocks using a technical analysis toolkit that has been wielded successfully for hundreds of years. That’s no exaggeration.
That makes these patterns some of the most time-tested strategies in finance. You can feel secure that you are trusting your investments to a highly refined system – not a new craze or an analyst’s hunch.
There are hundreds of patterns in stock charts that traders can look for, but atChartAdvisor, we focus only on the most trusted.
—-
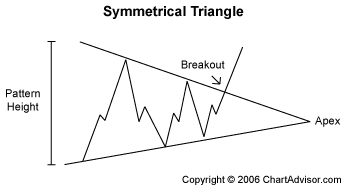
Profitable Pattern Number One The Symmetrical Triangle: A Reliable Workhorse You’ll recognize the symmetrical triangle pattern when you see a stock’s price vacillating up and down and converging towards a single point. Its back and forth oscillations will become smaller and smaller until the stock reaches a critical price, breaks out of the pattern, and moves drastically up or down. The symmetrical triangle pattern is formed when investors are unsure of a stock’s value. Once the pattern is broken, investors jump on the bandwagon, shooting the stock price north or south.
How to Profit from Symmetrical Triangles Symmetrical triangles are very reliable. You can profit from upwards or downwards breakouts. You’ll learn more about how to earn from downtrends when we talk aboutmaximizing profits. If you see a symmetrical triangle forming, watch it closely. The sooner you catch the breakout, the more money you stand to make. Watch For:
Set Your Target Price: As with all patterns, knowing when to get out is as important as knowing when to get in. Your target price is the safest time to sell, even if it looks like the trend may be continuing. For symmetrical triangles, sell your stock at a target price of:
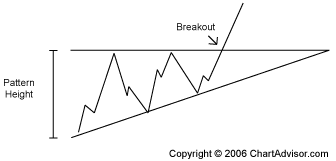
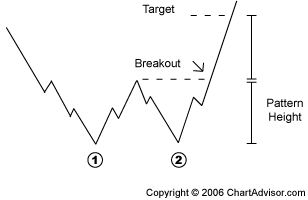
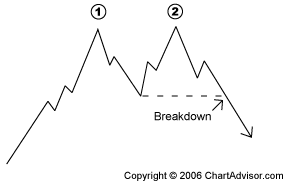
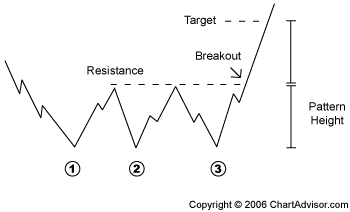
ChartAdvisor Symmetrical Triangles in Action ChartAdvisor has a long history of identifying symmetrical triangle patterns. Over the last two and one-half years, ChartAdvisor has brought to its readers over 20 symmetrical triangle patterns. That’s an average of one every month and a half. 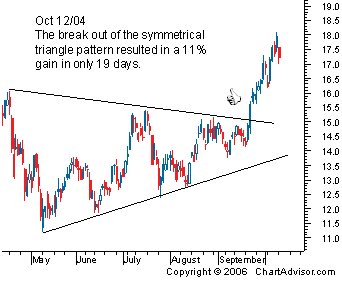 Our members earned 11% in 19 days on the PAAS symmetrical triangle pattern. If you’re not sure you can recognize a symmetrical triangle on your own, be sure to visitChartAdvisor.comdaily for out Charts of the Day. —- Profitable Pattern Number Two Ascending and Descending Triangles: The Traditional Bull and Bear When you notice a stock has a series of increasing troughs and the price is unable to break through a price barrier, chances are you are witnessing the birth of an ascending triangle pattern.
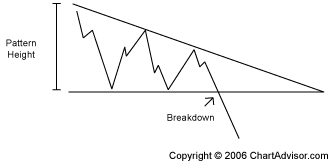
The descending triangle is the bearish counterpart to the ascending triangle.
The ascending and descending patterns indicate a stock is increasing or decreasing in demand. The stock meets a level of support or resistance (the horizontal trendline) several times before breaking out and continuing in the direction of the developing up or down pattern. How to Profit from Ascending and Descending Triangles Ascending and descending triangles are short-term investor favorites, because the trends allow short-term traders to earn from the same sharp price increase that long-term investors have been waiting for. Rather than holding on to a stock for months or years before you finally see a big payday, you can buy and hold for only a period of days and reap in the same monster returns as the long-time stock owners. As with many of our favorite patterns, when you learn to identify ascending and descending triangles, you can profit from upwards or downwards breakouts. That way, you’ll earn a healthy profit regardless of where the market is going. Watch For:
Set Your Target Price: For ascending and descending triangles, sell your stock at a target price of:
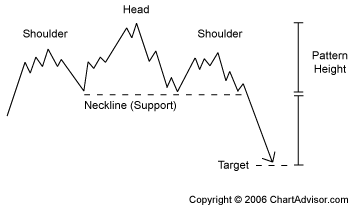
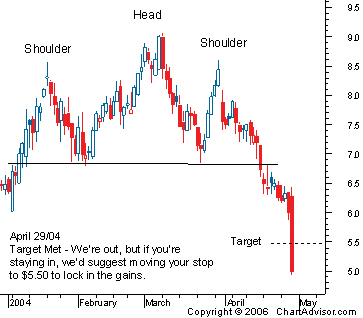
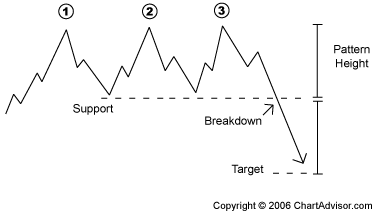
ChartAdvisor Ascending and Descending Triangles in Action Ascending and descending triangles are some of our most popular patterns, because their features are so clear and the breakouts are almost always fast and furious. Flanders Corp (FLDR) earned our readers 28% in 18 days. Dominos Pizza (DPZ) jumped 12% in 20 days after we pinpointed the breakout point on June 13, 2005. Another of our winning picks in 2005, Dril-Quip Inc (DRQ) jumped 12% in just 6 days. On Boyd Gaming (BYD), investors following our pick earned a whopping 29% in 35 days. 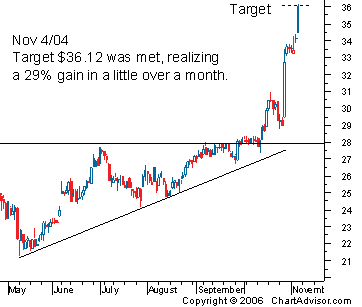 Our readers earned 29% in 35 days on the BYD ascending triangle pattern. As a ChartAdvisor regular you would have reaped incredible profits on the 60 ascending and descending triangle picks we’ve made since our program’s beginning. We features an average of two of these cash cows per month, making them one of the most prevalent and predictable patterns in your toolbox. —- Profitable Pattern Number Three Head and Shoulders: A ChartAdvisor Staple The head and shoulders pattern is a prevailing pattern among short sellers, investors who profit from downtrends. After three peaks, the stock plummets, offering a textbook, high-return opportunity to traders who catch the trend early.
The first trough is a signal that buying demand is starting to weaken. Investors who believe the stock is undervalued respond with a buying frenzy, followed by a flood of selling when traders fear the stock has run too high. This decline is followed by another buying streak which fizzles out early. Finally, the stock declines to its true worth below the original price. How to Profit from the Head and Shoulders Pattern
Set Your Target Price: For the head and shoulders pattern, buy shares at a target price of:
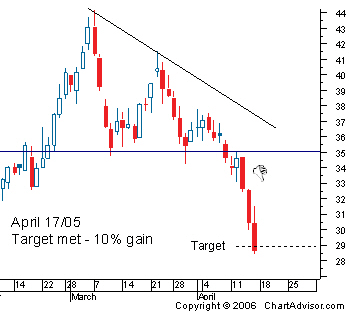
ChartAdvisor Head and Shoulders Pattern in Action Profiting from a downtrend can seem counterintuitive at first, but ChartAdvisor.comreaders soon learn the benefits of being able to profit in up OR down markets.
This head and shoulders pattern on PAWC shot up an astonishing 27% in just 33 days. —-
|
http://www.chartadvisor.com/freereport/report_index.aspx
Subscribe to:
Comments (Atom)
